Mapping Touchpoints to Journey Stages
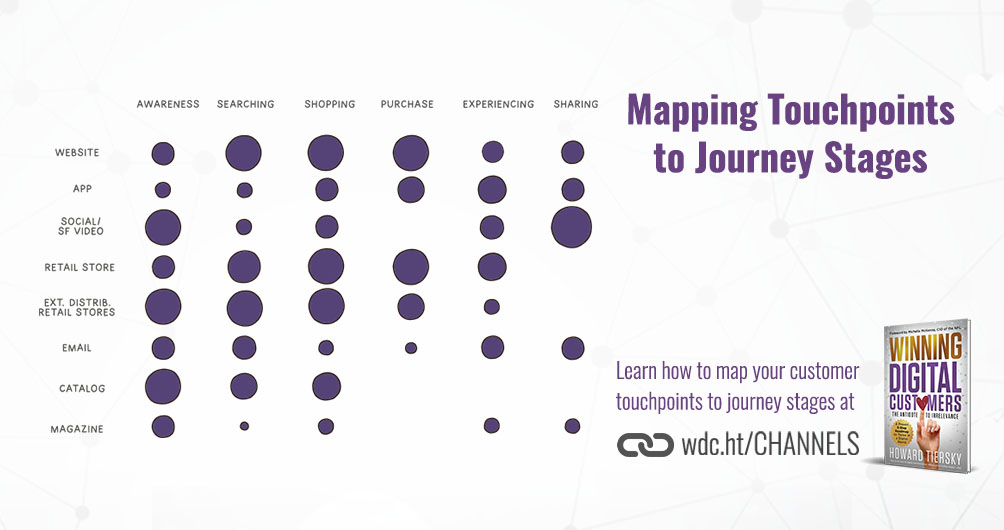
As you research your customers, it can be helpful to create visualizations to communicate what you have learned in your research about how different customer segments use different touchpoints and whether some touchpoints are more frequently used at different stages of the customer journey.
The diagram provides an “at-a-glance” way to understand to what degree each customer touchpoint is utilized at each step of the purchase process. The size of each circle indicates how popular that touchpoint is for customers in each stage of the buying lifecycle. This is useful in many ways. For example, when working on a given touchpoint, such as the website or catalog, it’s helpful to know how customers are really using it, so you can focus content or capability improvements in a way that aligns with customer behavior.
For more on how to effectively produce and display customer research, check out Winning Digital Customers by Howard Tiersky. The book offers a proven, 5-step methodology for using customer research to create a new, beloved customer journey. Go to WinningDigitalCustomers.com to buy the book today!